Visualize brightness relationships among modes of a scale
Source:R/brightnessgraph.R
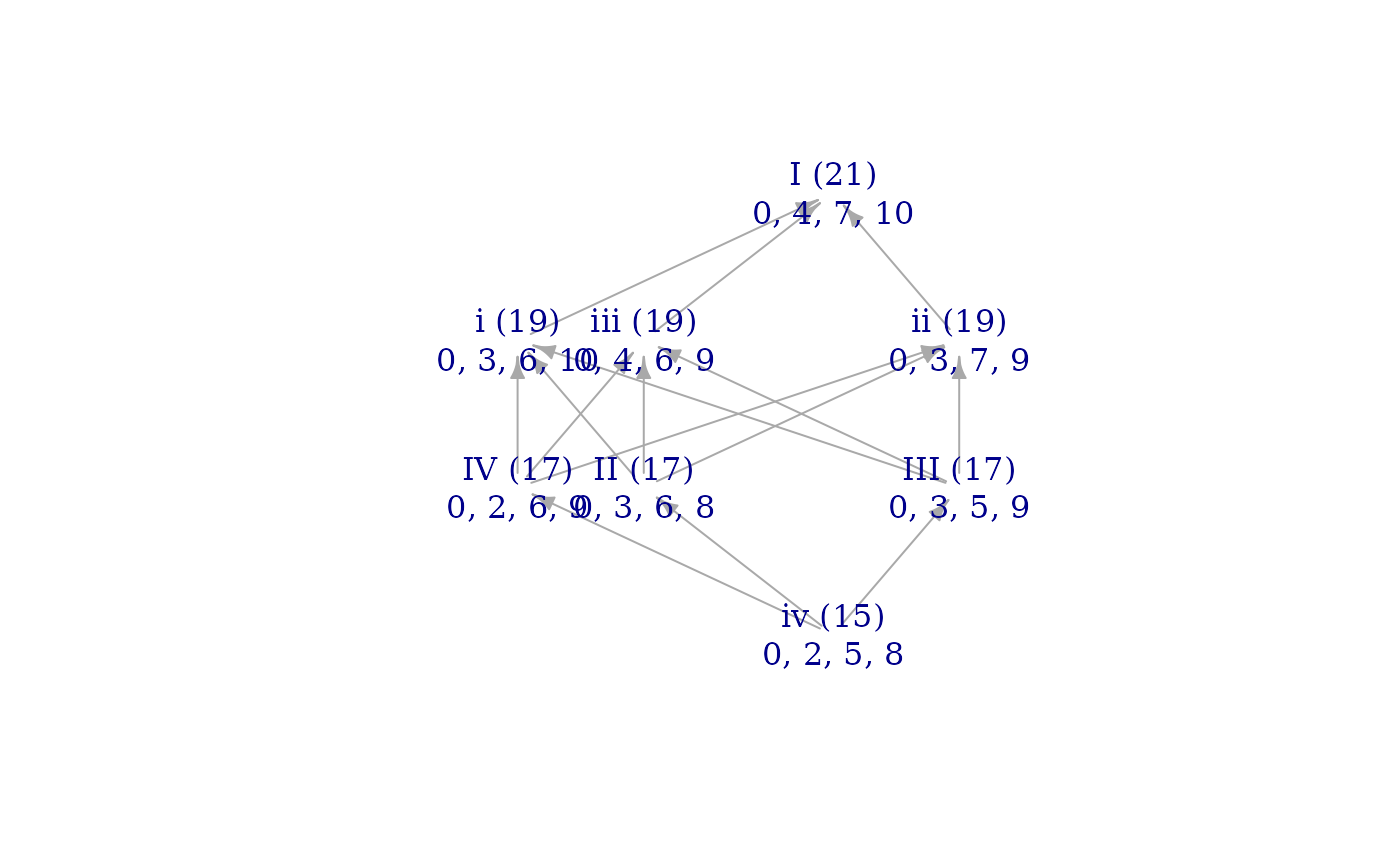
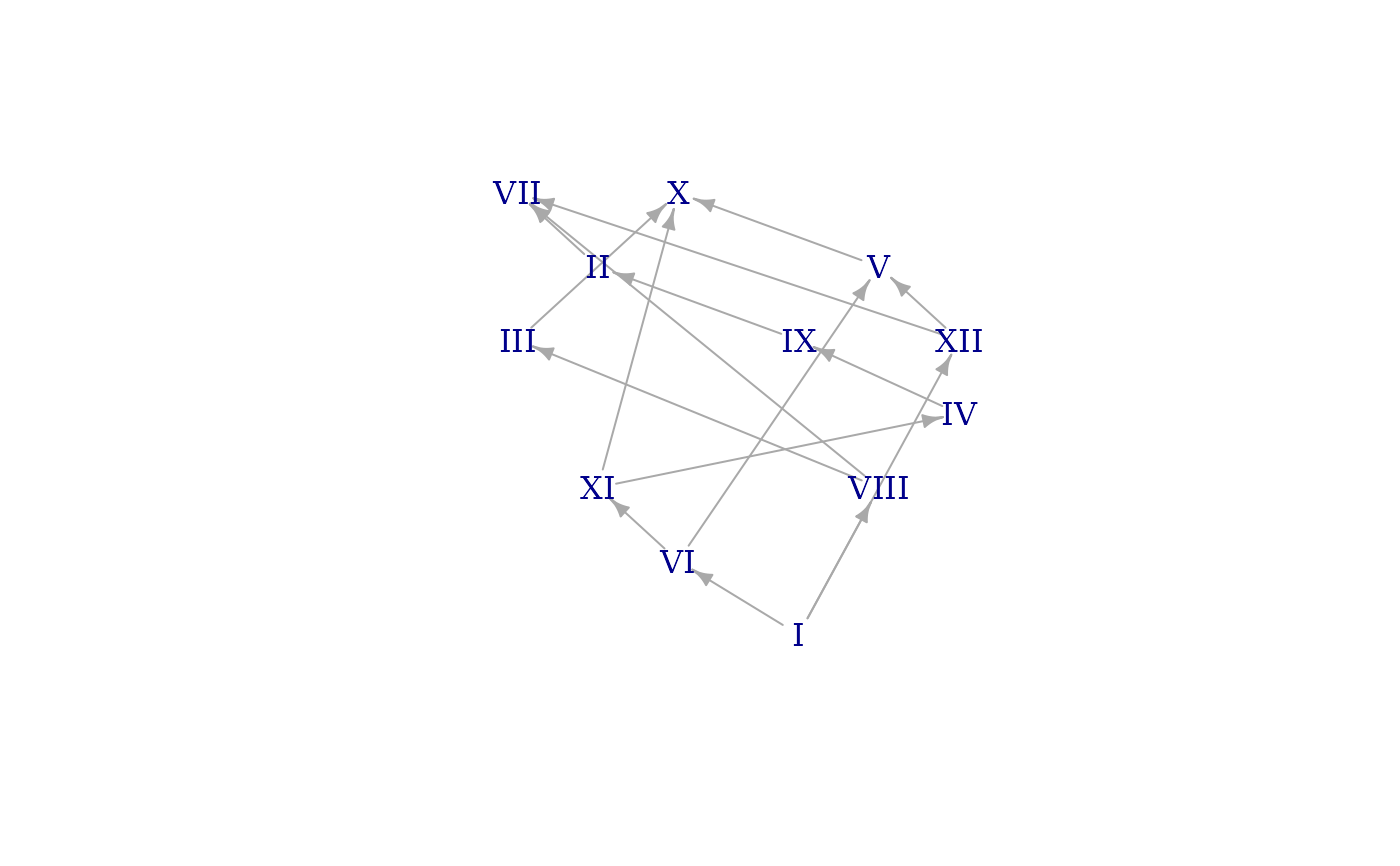
brightnessgraph.RdDiscussed in "Modal Color Theory" (pp. 7-11), the brightness graph of a scale is a Hasse diagram that represents the sum- and voice-leading brightness relationships between the modes of a scale. Each node of the graph represents a mode. With default options, the large Roman numeral of each node indicates which mode of the input scale it represents. (The input scale is roman numeral I.) Small Arabic numerals beneath the Roman numeral indicate the pitch-classes of the mode (relative to scale degree 1 as 0). In parentheses, the sum brightness of the mode is shown. Modes with higher sum brightness are farther up on the graph. Arrows connect modes that can be compared by voice-leading brightness. The arrows only show a transitive reduction of all VL-brightness comparisons, so that if you can travel between two sets by only going "up" or "down" the arrows, the source and destination are indeed related by voice-leading brightness.
If goal=NULL (as it is by default), the brightness graph includes simply the modes of set. However,
goal can be any other scale of the same length as set, in which case the brightness graph includes
modes of both sets and their interconnections. The modes of goal are represented by lower-case roman
numerals, while upper-case numerals represent the modes of set.
Various visual parameters can be configured: numdigits determines how many digits of each pitch-class
to display; show_sums toggles on or off the sum brightness values; show_pitches toggles on or off
the individual pitch classes of each mode; fixed_do, if set to TRUE switches the graph from showing
"parallel" modes (e.g. C ionian vs C aeolian) to showing "relative" modes (e.g. C ionian to A aeolian).
For now, the function doesn't have a smart way to determine the horizontal positioning of modes in the graph. It uses a heuristic that works well for many sets, but sometimes it will create too much visual overlap or won't clarify underlying structure particularly well. Think of these automatically generated graphs as the starting point for manual fine tuning.
Usage
brightnessgraph(
  set,
  goal = NULL,
  numdigits = 2,
  show_sums = TRUE,
  show_pitches = TRUE,
  fixed_do = FALSE,
  edo = 12,
  rounder = 10
)
Arguments
- set
Numeric vector of pitch-classes in the set
- goal
Numeric vector of same length as set. Defaults to
NULL.- numdigits
Integer: how many digits of each pitch-class to show? Defaults to
2.- show_sums
Boolean: should the graph show sum brightness values? Defaults to
TRUE.- show_pitches
Boolean: should the graph show values for each note of the scale? Defaults to
TRUE.- fixed_do
Boolean: should the graph use only the fixed pitches of the input set? Defaults to
FALSE.- edo
Number of unit steps in an octave. Defaults to
12.- rounder
Numeric (expected integer), defaults to
10: number of decimal places to round to when testing for equality.
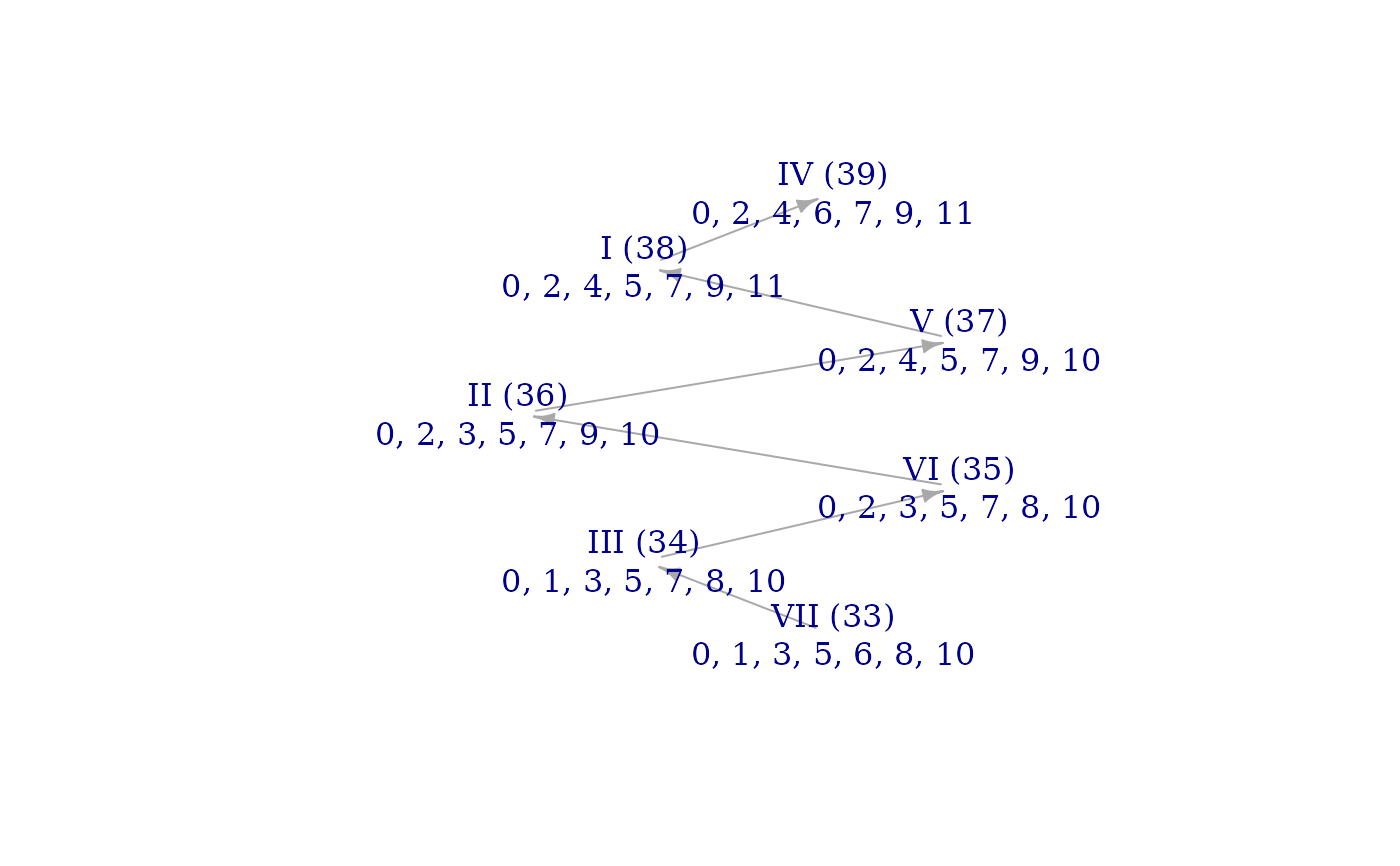
Examples
brightnessgraph(c(0,2,4,5,7,9,11))
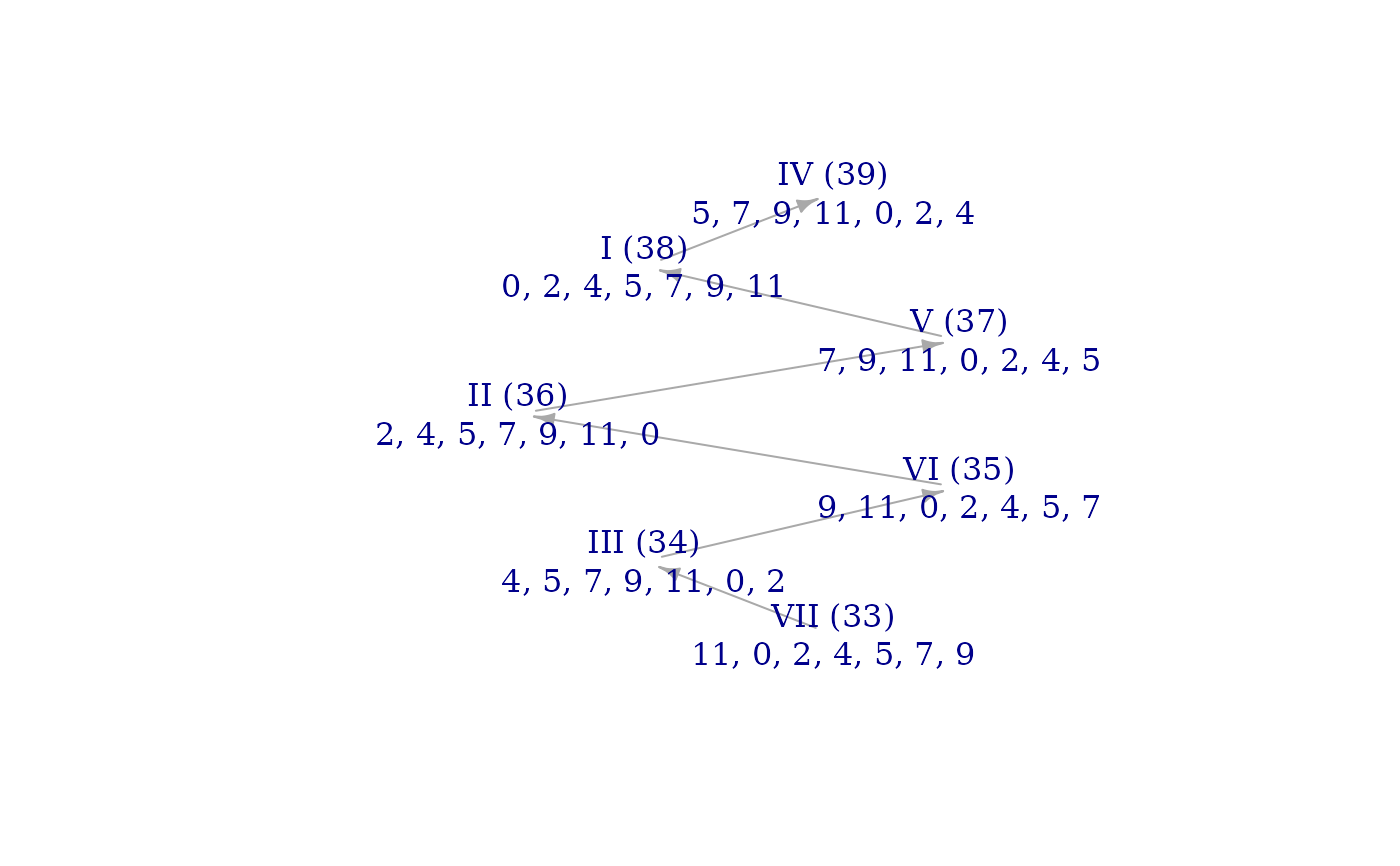
 brightnessgraph(c(0,2,4,5,7,9,11), fixed_do=TRUE)
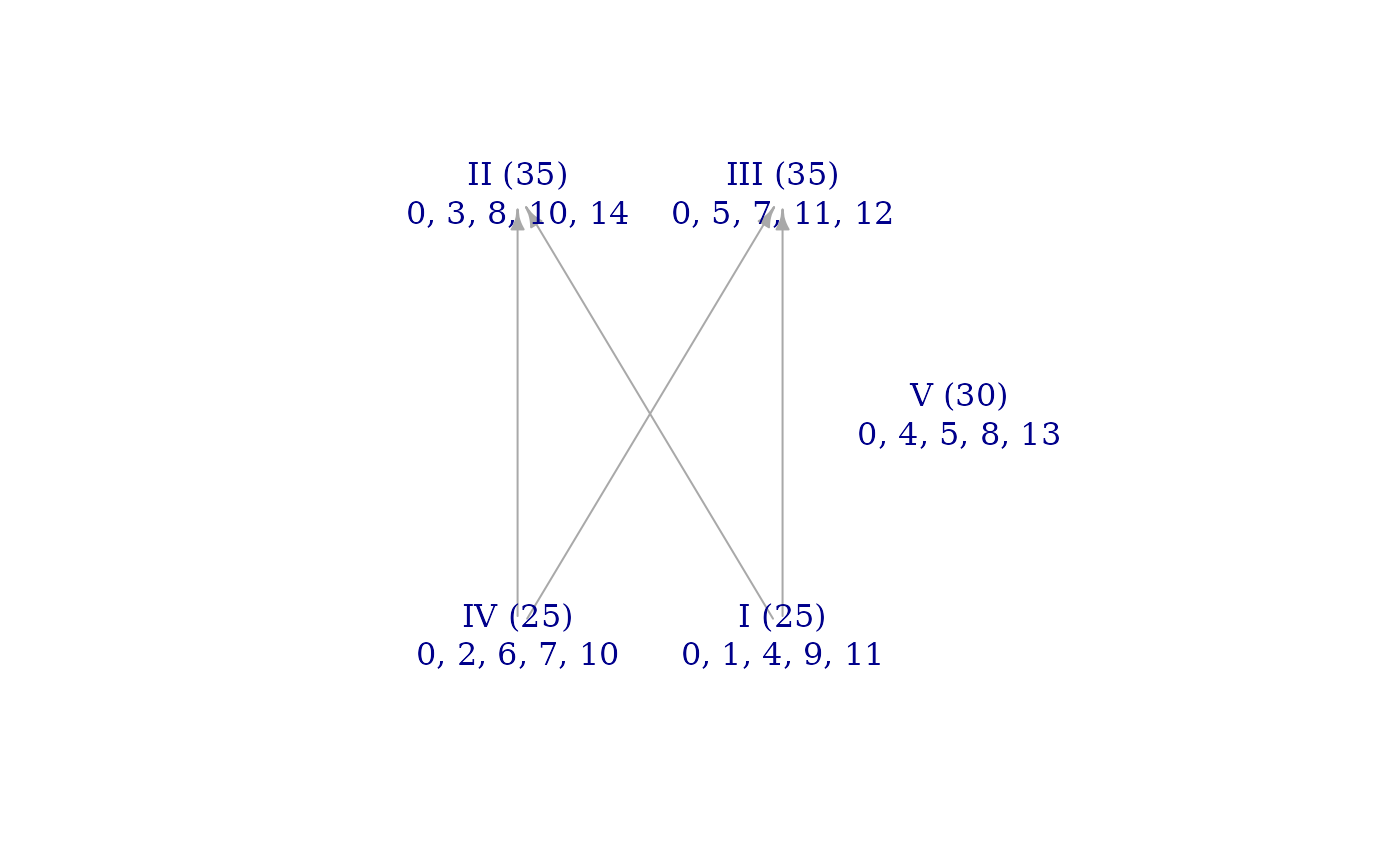
 brightnessgraph(c(0,1,4,9,11),edo=15)
 #### A more complicated graph
werck_ratios <- c(1, 256/243, 64*sqrt(2)/81, 32/27, (256/243)*2^(1/4), 4/3,
1024/729, (8/9)*2^(3/4), 128/81, (1024/729)*2^(1/4), 16/9, (128/81)*2^(1/4))
werckmeister_3 <- z(werck_ratios)
brightnessgraph(werckmeister_3, show_sums=FALSE, show_pitches=FALSE)
#### A more complicated graph
werck_ratios <- c(1, 256/243, 64*sqrt(2)/81, 32/27, (256/243)*2^(1/4), 4/3,
1024/729, (8/9)*2^(3/4), 128/81, (1024/729)*2^(1/4), 16/9, (128/81)*2^(1/4))
werckmeister_3 <- z(werck_ratios)
brightnessgraph(werckmeister_3, show_sums=FALSE, show_pitches=FALSE)
 #### Graph for both inversions of the Tristan genus:
dom7 <- c(0, 4, 7, 10)
halfdim <- c(0, 3, 6, 10)
brightnessgraph(dom7, halfdim)
#### Graph for both inversions of the Tristan genus:
dom7 <- c(0, 4, 7, 10)
halfdim <- c(0, 3, 6, 10)
brightnessgraph(dom7, halfdim)